Writing Test 93
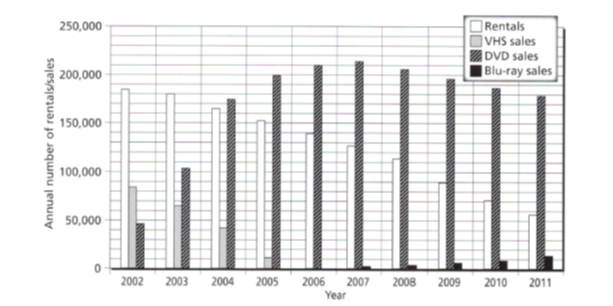
Task 1: The chart below shows the annual number of rentals and sales (in various formats) of films from a particular store between 2002 and 2011.
Summarize the information by selecting and reporting the main features and make comparisons where relevant.
Write at least 150 words.
Task 2: Some people say that the government should decide what subjects a student can study, while others believe the students should decide what they want to study. Discuss both views and give your opinion. 18. Fewer and fewer young people are choosing to become teachers. Why do young people not want to be teachers? How this could be changed?
Write at least 250 words.
the pie chart gives information about the number of people who purchased or take rent for film equipments from a specific store. the data is recorded for nine years from 2001 to 2011
in the first half of the chart rental was popular however, in the second half the sale of blu-ray was trending.
initially in 2002 under 2 lacs people took rent for film equipments however, in the next years the number slowly and steadily decreased and plunged to over half a million in the final year.
the sales of blu-ray was only under 50,000 but it increased rapidly and reached to Peak of two lakhs in 2007 before experienced a slight downfall and reached to under 2 lacs.
in 2002 the sales of VHS was around 75,000 but plunged to around 10,000 in 2005 and recorded almost nill in further years. whereas, the sale of DVD was remade under half a million thought the given period.
It is not a pie chart it is a bar graph. In the first line you have made a blunder so you have restricted your score by giving the impression that you do not know the difference between basic graphs. ‘or take rent for film equipments’ or took different types of movie media on rent. 2 lacs is not international standard so use 200,000. The international standards are million and billion. You need to work on your basic sentence structure first.
Thanks alot